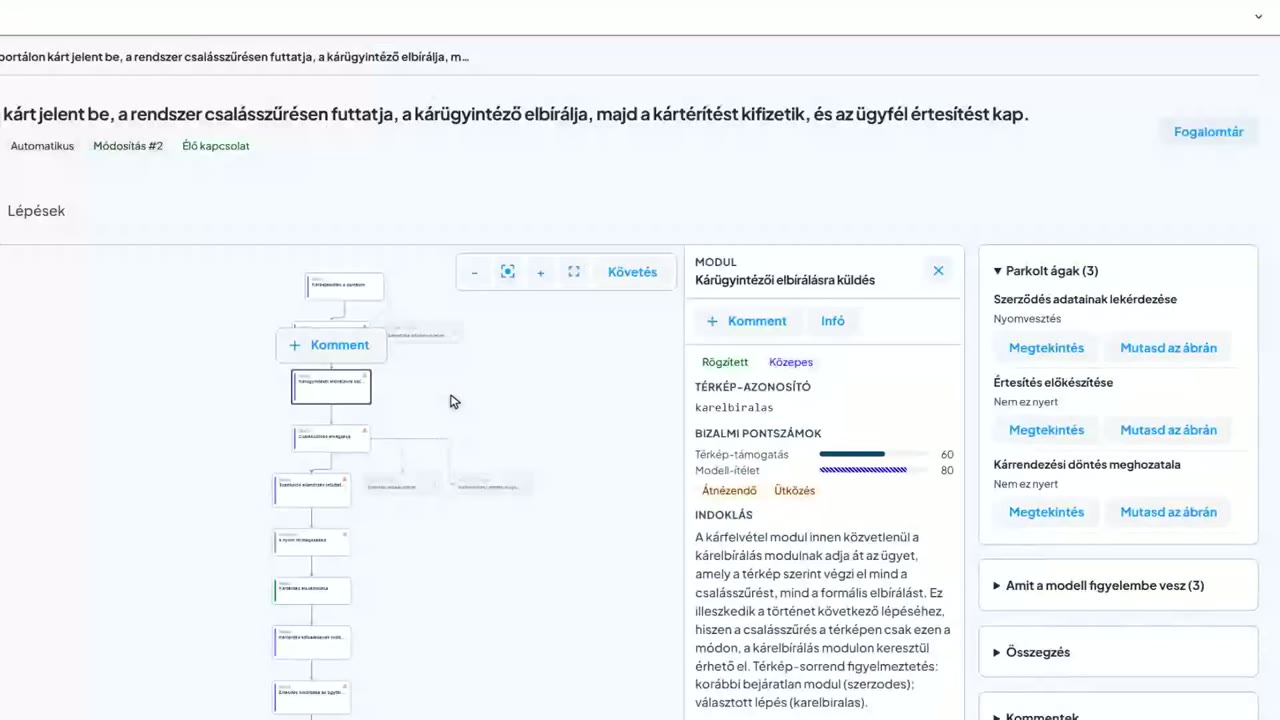
Detailed walkthrough
All of Legacy Explorer in under six minutes: the map of code, processes and database, the connections, impact analysis and the knowledge base.
Transcript
Nitro Legacy Explorer builds the documentation of a system that has no usable description, from its code. It maps two kinds of systems. One is application code, with the processes running in it.
The other is the database, where there is no code, only a schema. The back office of a leading Central European banking group: roughly 570 business processes, 500 Java delegates, 550 tables, 45 connected external systems. That no longer fits in one head.
The knowledge lives in heads and tickets, the development team calls even its own process layer too tangled, and written documentation is out of date by the time it is finished. Meanwhile two runtimes run side by side, a twenty-year-old monolith and a ten-year-old modernised platform, and the workflow engine is at the end of its life. By hand this is about six months of work, and by the time it is done, it is no longer true.
Today there are three kinds of answers to this. The magnifying glass: developer code graph tools that build a deterministic graph from the grammar of the code. They are good for what calls what.
The encyclopedia: general code analysis platforms that read everything into one shared search layer. They work on everything straight away, but everywhere at the same medium depth. The third is the map, and that is what we do: targeted, layered analysis that answers what your system does in business terms.
For that, we work in reverse order. First a deterministic scan reads through the source: call graphs, dependency edges, interface inventory, fingerprints. What a parser can read, we don't leave to a model.
The model only comes after that, and it doesn't search, it interprets: module by module, in dependency order, always with just the relevant context. This is the result: the system broken into modules, with the calls running between them. This picture shows that we can survey a complex system too.
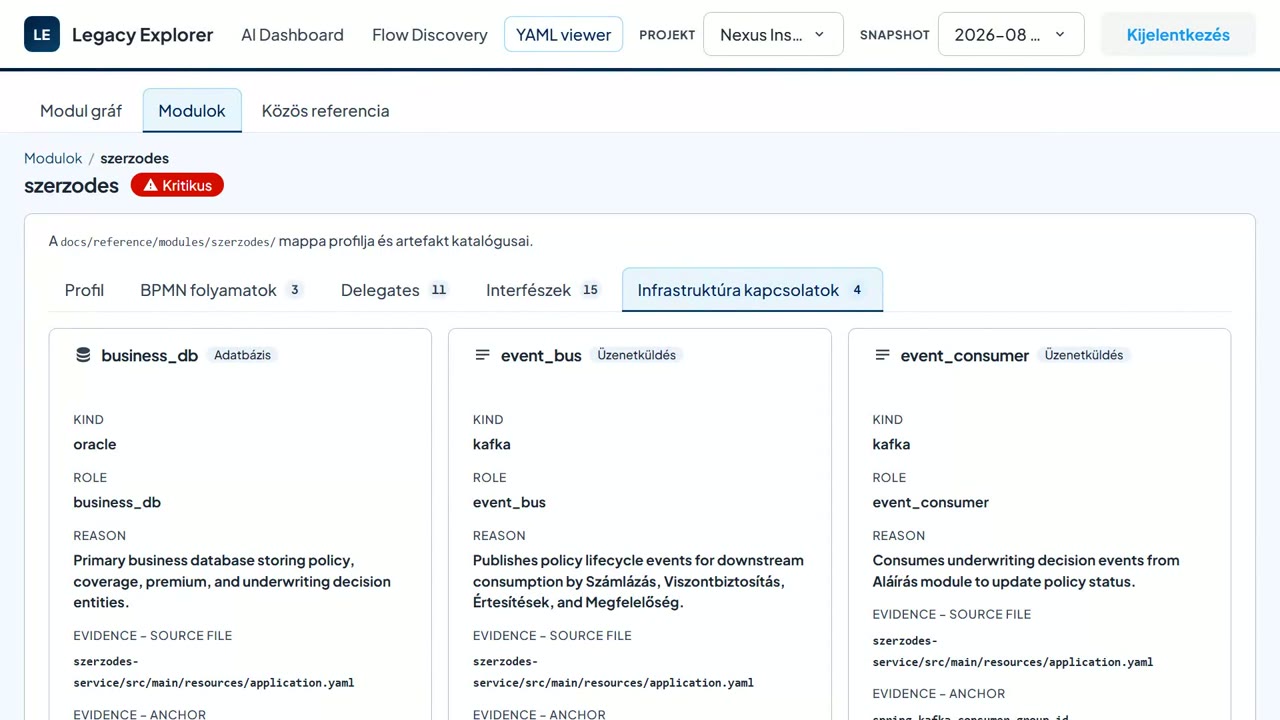
But if you are curious about one part, just click on it. The first source is the code itself. Each module gets a readable profile that answers what a new colleague or a business analyst would ask: what does this part do, who does it work for, what can it do.
Next to it, the architecture shows the boundaries, and the codebase shows the size, in files and lines, broken down by role. Complexity shows where the intricacy is concentrated, so where it is expensive to touch, and what is worth thinking twice about before a migration. These are not estimates, but values computed from the code.
The second source is the process. Where Camunda runs, the process definitions go into the analysis too, and the system follows step by step which task calls which piece of code. These are the delegates, and behind each one is the source file we read it from: a real Java path from the codebase.
You don't have to take it on trust, you can check it. It also shows what exists on paper but nobody starts any more in practice. The same process can be viewed as a diagram too.
On the left, the annotated diagram: colour shows the happy path, the error branch, and where commits happen. On the right, the generated business view: what the process does, what starts it, what it produces, and which terms it relates to. Both come from the same analysis, so the diagram and the description cannot drift apart.
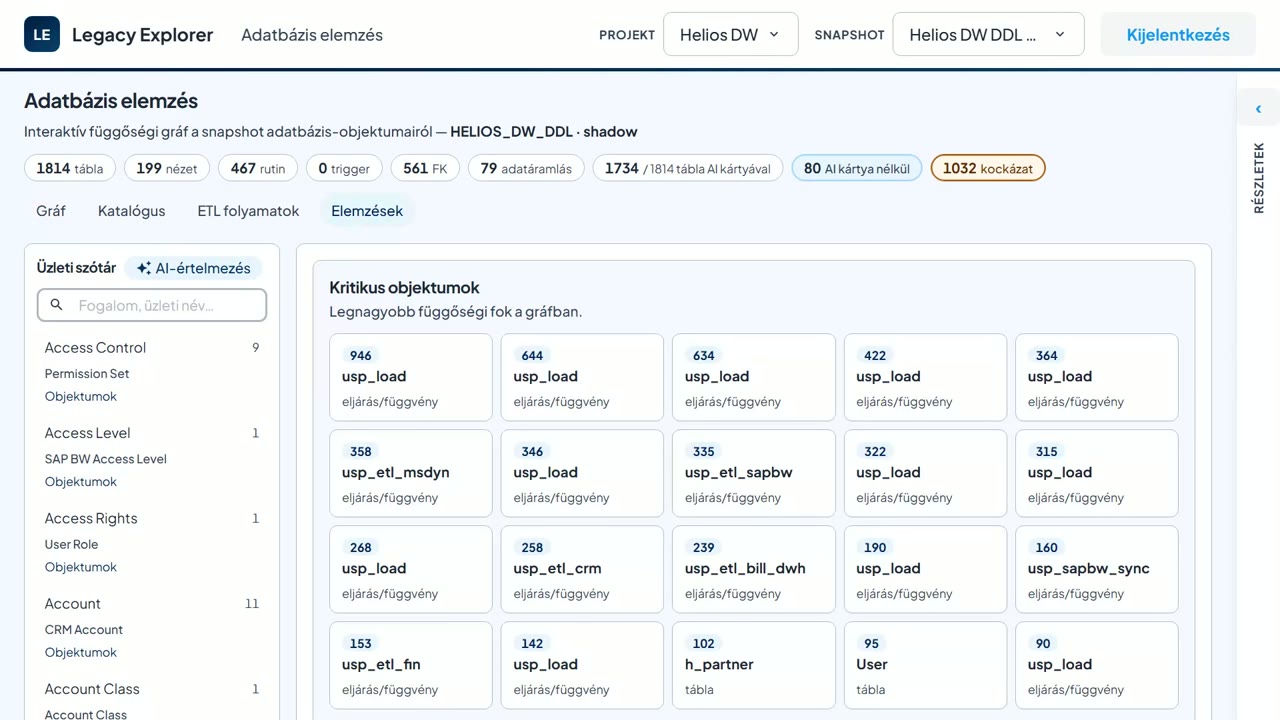
And this is not one lucky case: the next example is another process, with the same breakdown. The third source is the database, the hardest case, because there is no code here, only a schema. This example has nearly two thousand tables and several hundred stored procedures, with no comments.
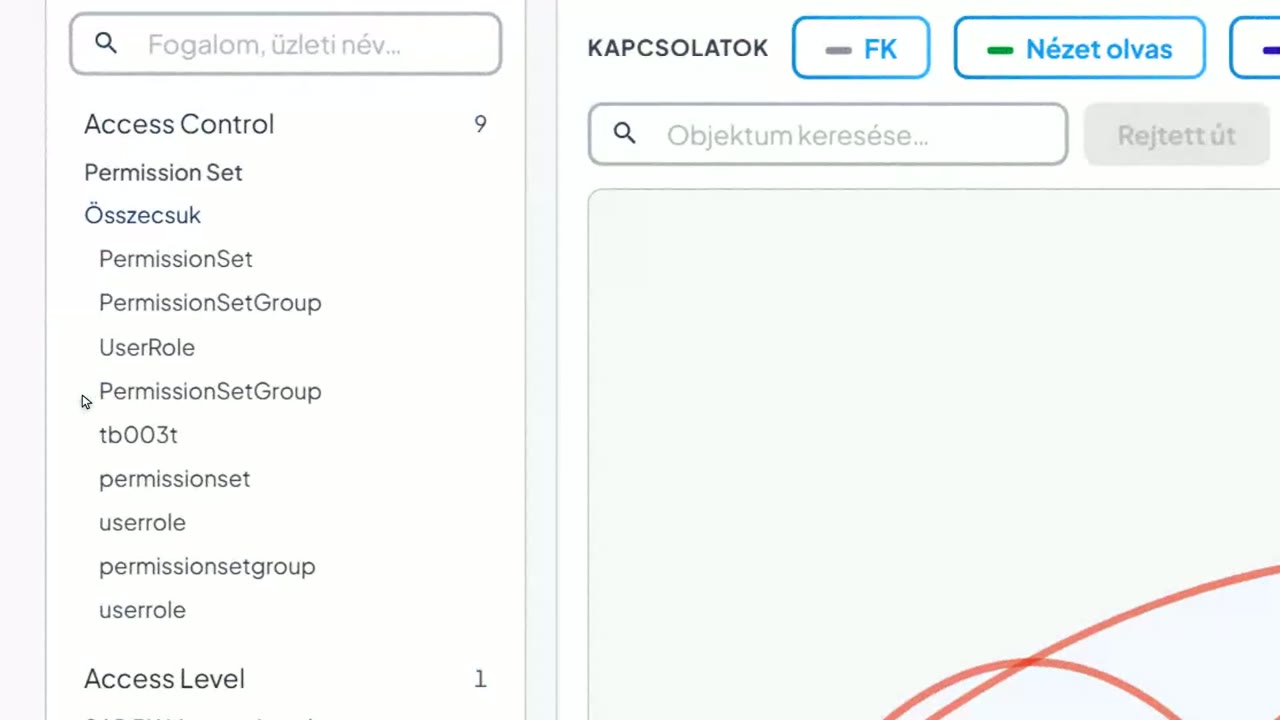
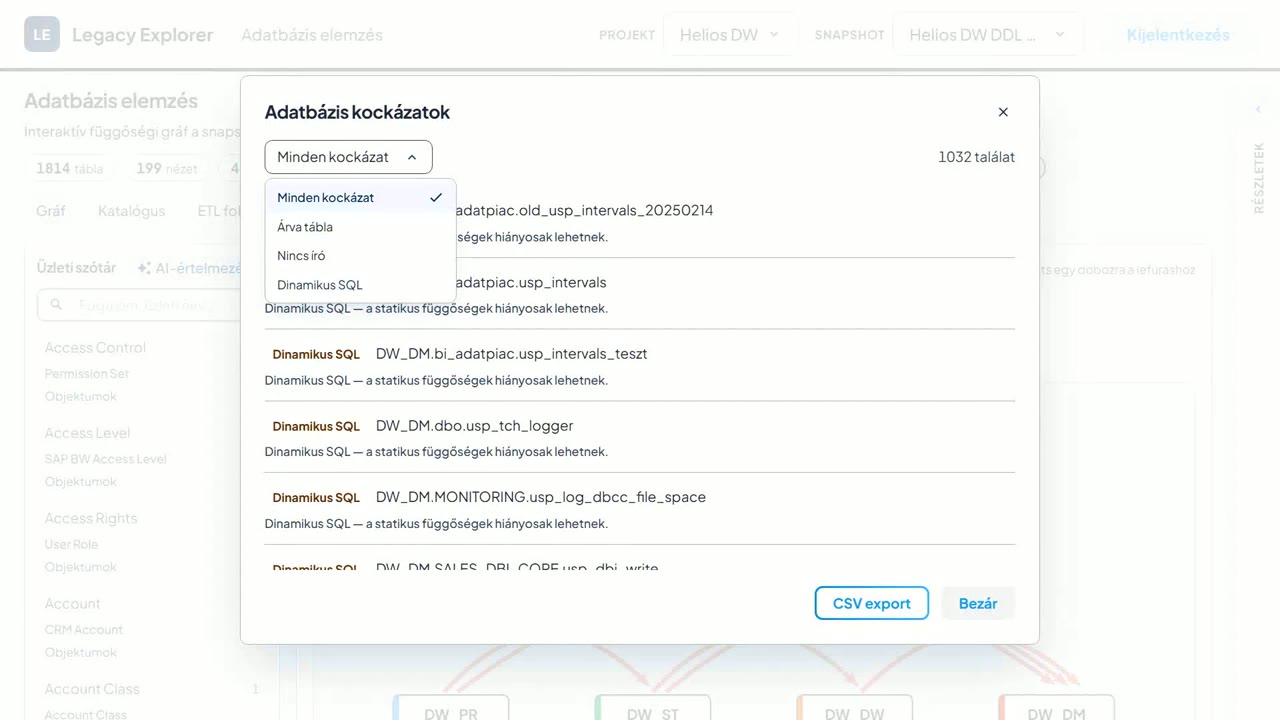
The system can still work out what connects to what, because it reads it from the definitions. And it doesn't just say what it found, but also what it didn't: here 1,734 objects got an interpretation, 80 did not. It sorts the missing ones by importance.
This list is the question the system asks you. What the three sources add up to is not a list, but a network of connections. For every module you can see where calls come from and where they go next, through which interface, and what the call is for.
That gives the answer to the most common question: what happens if we touch it. You can give a starting object and a target, and the system finds whether a path leads between them, and through which layers. That is the work a developer needs a week or two for today.
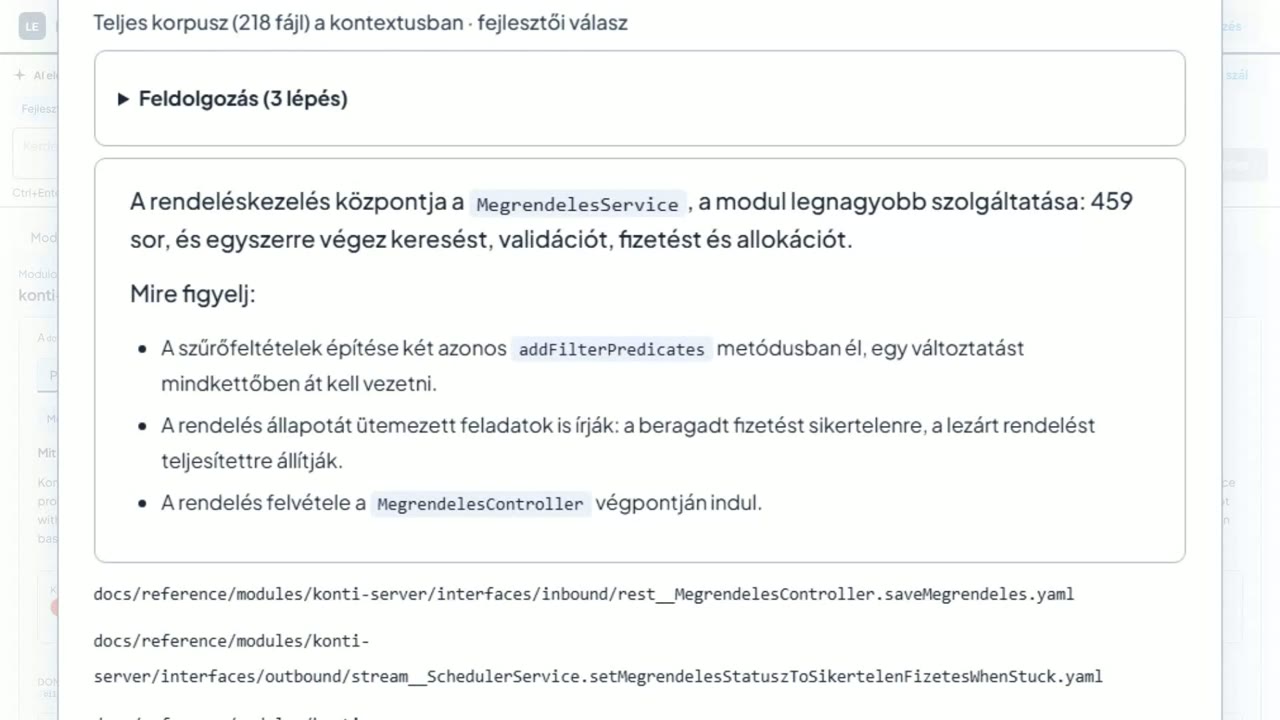
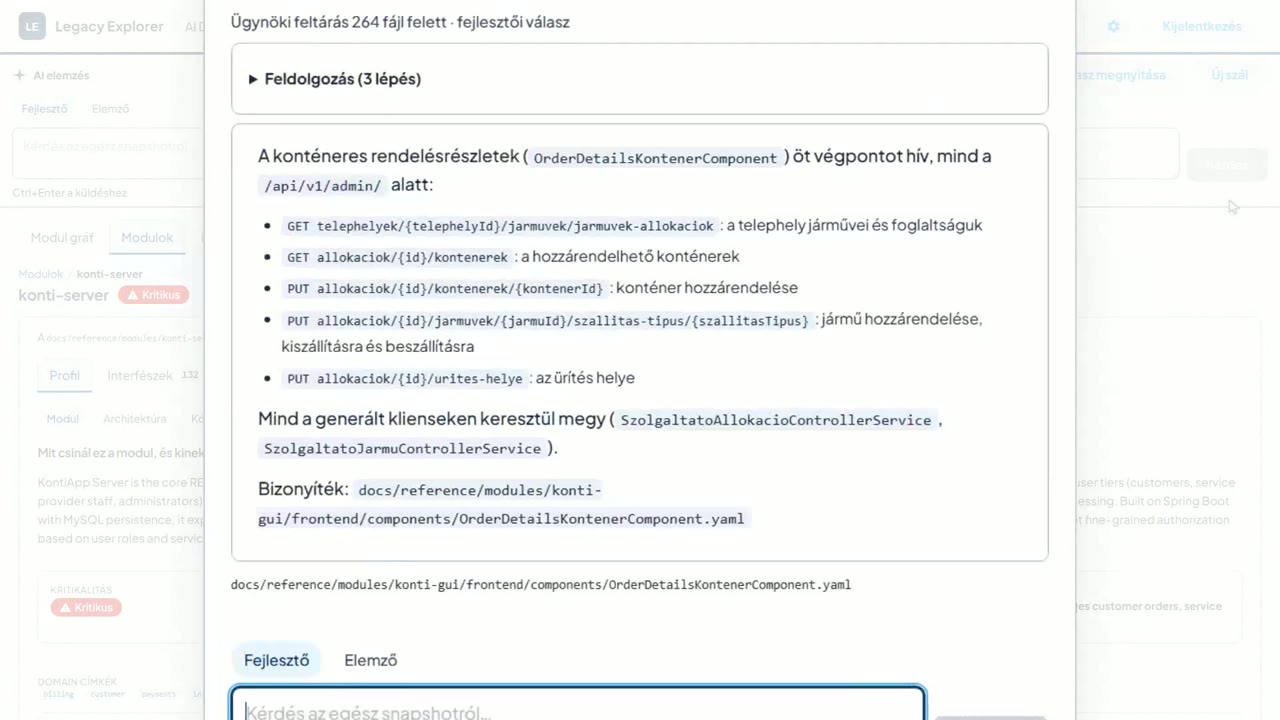
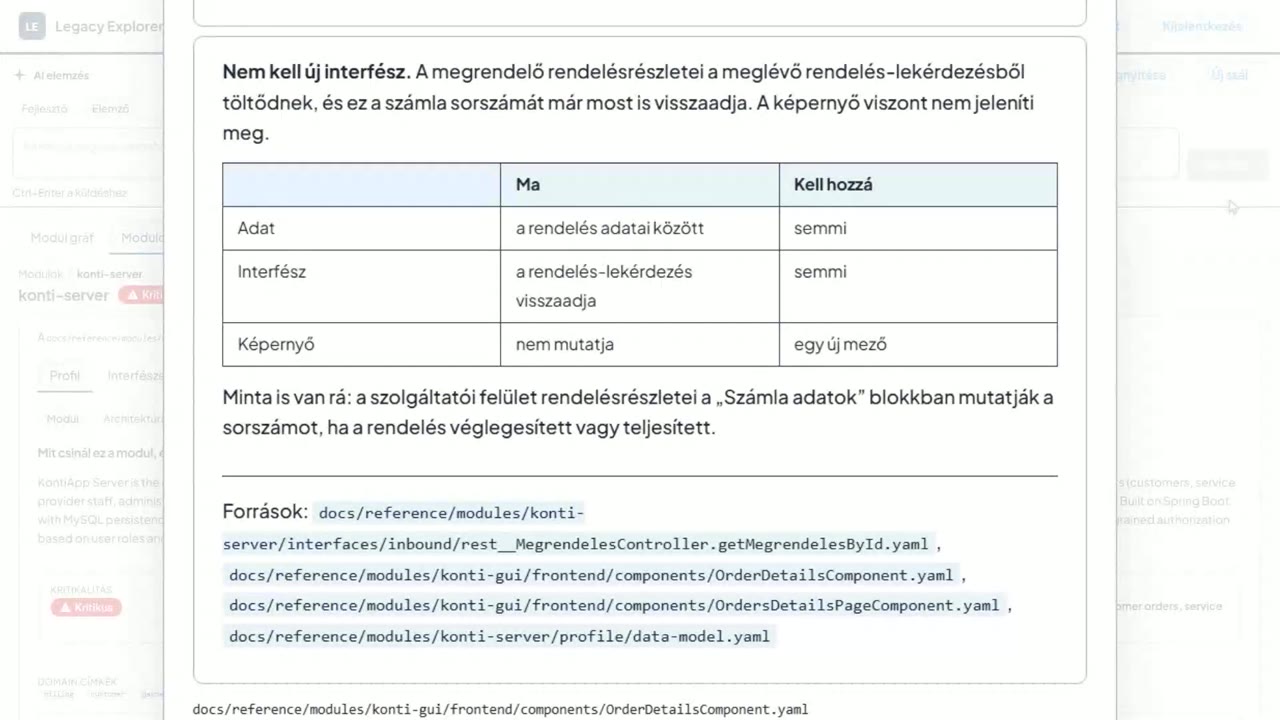
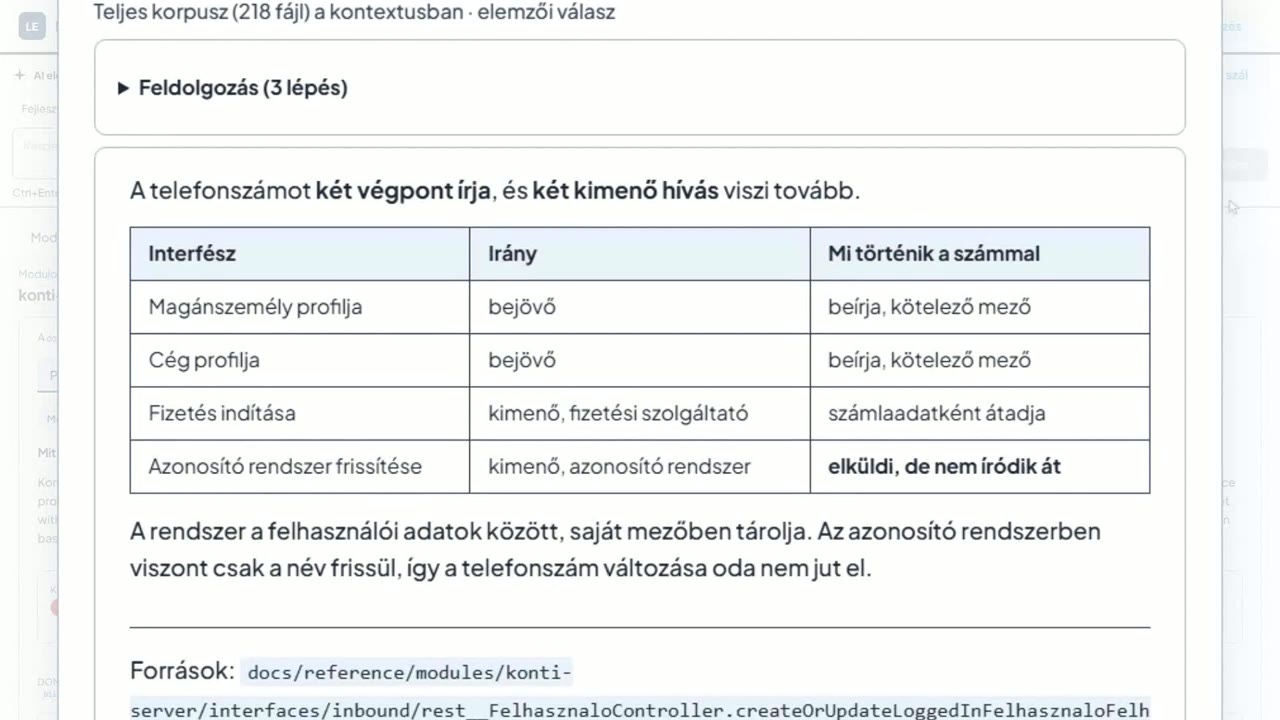
This interface is not the only output. The result of the analysis is a queryable knowledge base that your own tools can ask: about business terms, processes, delegates, impact analysis. The same knowledge is available from the developer's editor, from the analyst's chat interface, and even behind a company knowledge base.
You don't have to go where the documentation is for the answer: it is where you work. You can also ask in plain language. The system draws from the analysed data: which modules depend on each other, where the unresolved references are, what the full catalogue is.
Questions can be saved, so what you have put into words once, you don't have to phrase again next time. It is not a separate product or separate data, but the same map from another angle. The map is built from connections it reads out, not from guesswork, and every claim has its source file behind it.
Not a one-off report: it can be regenerated after every change, and always describes the current state. The analysis can run in your own environment, and the source code never leaves it.